
ORR on high entropy alloys
High-Entropy Alloys as a Discovery Platform for Electrocatalysis
Thomas Batchelor, Jack Pedersen, Simon Winther, Ivano Castelli, Karsten Jacobsen and Jan Rossmeisl
T. Batchelor et al. / Joule 2019DOI: https://doi.org/10.1016/j.joule.2018.12.015Description
This paper describes a model that we developed in order to investigate the possibilities of using high-entropy alloys (HEAs) as a surface to catalyse the ORR. HEAs are a class of alloy composed of at least 4 primary constituent elements, forming a random solid solution. In other words the constituent elements are randomly distributed throughout a single phase metallic lattice structure (such as FCC or BCC). Due to the influence of the different elements constituting the atomic neighborhood around a binding site there are many millions of adsorption energies available on an HEA a surface. We propose that some of these sites have optimal properties for catalysing a specific reaction. Since using density functional theory (DFT) to calculate binding sites for the full surface would take many years, we calculate the adsorption energy of *O and *OH (ORR intermediates) for a random subset of the available binding sites. With this data we apply a simple machine learning algorithm to predict the remaining adsorption energies, based on the composition of the immediate atomic neighborhood. Calculating a test set of adsorption energies we compare with the predictions and find an error of less than 0.1eV, which is approximately the same as the DFT uncertainty. Taking this data, which contains the knowledge of which local binding site compositions give the optimum adsorption energy we are able to re-engineer the composition of the HEA to increase the likelihood of these sites forming. Using this method we find an HEA composition that is predicted to be up to 4 times as active as pure Pt. Further to this we find, with unbiased composition optimisation, a binary alloy IrPt with a specific composition that leads to an activity enhancement of up to 28 times that of pure Pt, if the predicted adsorption energy uncertainty is ignored. We propose the use of HEAs for electrocatalysis under the assumption that a minority of binding sites with optimal properties will dominate the catalysis, and then find that the HEA can also be used to discover alloys composed of any combination of the constituent HEA elements.
Python classes for the linear regression model
The model is implemented using a collection of python classes found in the folder here.
The fingerprint generation, linear regression algorithm and predicted binding energy calculations are implemented using the class found in "LinearRegression.py". Descriptions of the different functions are detailed in this python class.
Details of the training and test slabs are extracted from an atoms object using the class found in "Slab.py". Descriptions of the different functions are detailed in this python class.
Methods used to aid different calculations made in these classes are found in "helperMethods.py".
Functions to establish a matplotlib plot style are found in "plot.py"
The Database
Training and test set data can be downloaded from here , as well as python scripts for running the slab relaxations.
Key-value pairs: DescriptionKey words for train.db database:
type: 'OH','O','slab'
slabID: '0','1','2','3'...N where N is the total number (-1) of each slab for each type;
for 'OH' N = 876 (877 slabs in total)
for 'O' N = 999 (1000 slabs in total)
for 'slab' N = 999 (1000 slabs in total)
Key words for the test.db database:
type: 'OH','O','slab'
slabID:'0','1','2','3'...N where N is the total number (-1) of each slab for each type;
for 'OH' N = 75 (76 slabs in total)
for 'O' N = 35 (36 slabs in total)
for 'slab' N = 75 (76 slabs in total)
The slab IDs exist for consistency, so that the structure with ID for an OH adsorbed slab corresponds with the same structure in O adsorbed or adsorbant-less slabs with the same ID.
Data structure stored in .csv files
The data in all of the csv files found in the linked depositories below have the following format:
'fingerprint, adsorption energy'
The fingerprint is set up as 15 (for *OH) or 55 (for *O) integers describing the number of each element found in different atomic zones composing the binding site and nearest neighbors (see paper linked above for details)
e.g. for *OH adsorption
0,0,0,1,0,0,1,2,1,2,1,0,2,0,0,1.123
Here the first 15 integers are the fingerprint ([0,0,0,1,0] = site, [0,1,2,1,2] = surface nearest neighbors, [1,0,2,0,0] = subsurface nearest neighbors, 1.123 = adsorption energy in eV. The [x,x,x,x,x] shown here corresponds to the number of of atoms from each element [Pt,Pd,Ir,Rh,Ru]).
The same goes for *O adsorption but with 55 integers, with the first 35 integers describing the 3-atom binding site ensemble (35 possible combinations with 5 elements) and the remaining 20 integers describing the 4 zones of nearest neighbors, similar as for *OH.
This is better described in the paper.
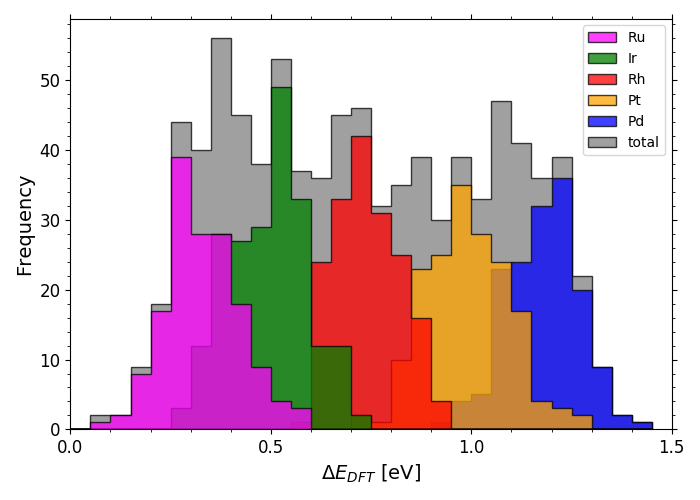
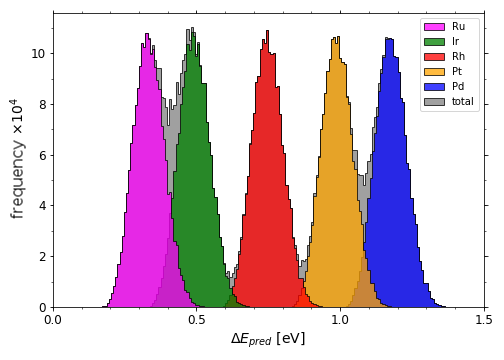
DFT calculated *OH adsorption energies on IrPdPtRhRu
DFT calculated *O adsorption energies on IrPdPtRhRu
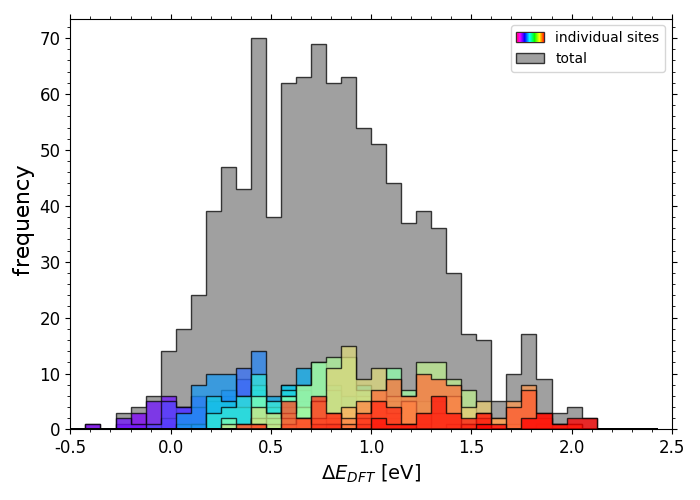
Scripts for plotting the previous two histograms can be found in a folder here under the name "X_DFT_histogram.py" with corresponding data in "X_train.csv" (where X is "OH" or "O").
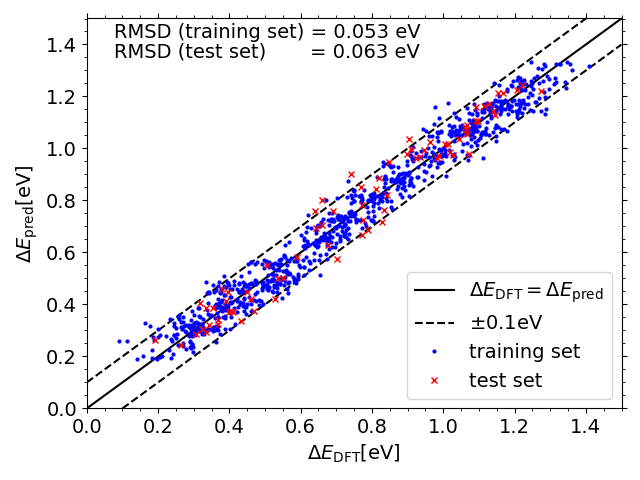
Predicted vs. DFT *OH adsorption energies on IrPdPtRhRu
Predicted vs. DFT *O adsorption energies on IrPdPtRhRu
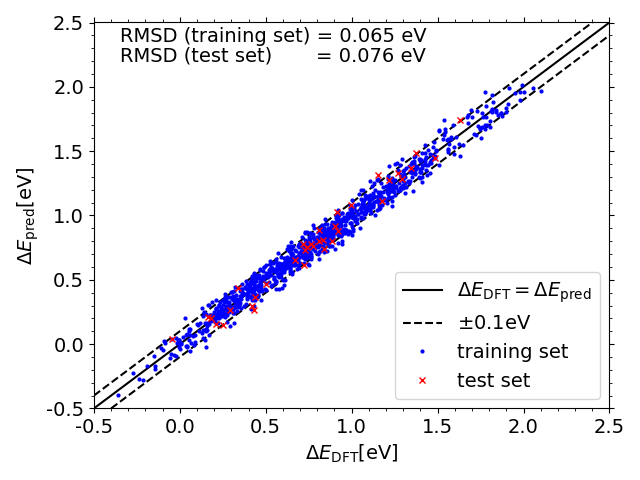
Scripts for plotting the previous two scatter plots can be found in a folder here under the name "X_DFT_vs_pred.py" (where X is "OH" or "O") with corresponding data in "X_train_pred.csv" and "X_test_pred.csv" (and "X_train.csv" and "X_test.csv" from the folder linked previously")
Full span of predicted *OH adsorption energies on IrPdPtRhRu
Full span of predicted*O adsorption energies on IrPdPtRhRu
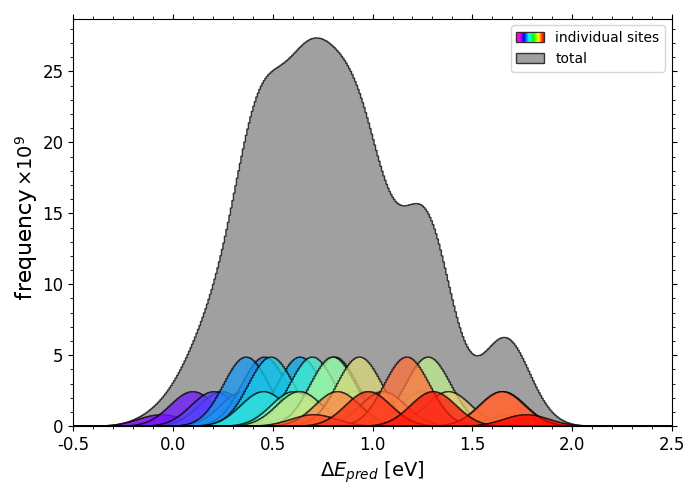
Scripts for plotting the previous two histograms can be found in a folder here under the name "X_pred_histogram.py" (where X is "OH" or "O") with corresponding *OH data in "OH_all_slabs.csv" and *O data in "O_all_slabs_Y.csv" (where Y is 0,1,2,3....34. The *O data had to be split into separate csv files).
Comparisons of *OH adsorption energy distributions for initial (a) and optimised (b-d) compositions;
a) Ir20Pd20Pt20Rh20Ru20
b) Ir10.2Pd32Pt9.3Rh19.6Ru28.9
c) Pd81.7Ru18.3
d) Ir17.5Pt82.5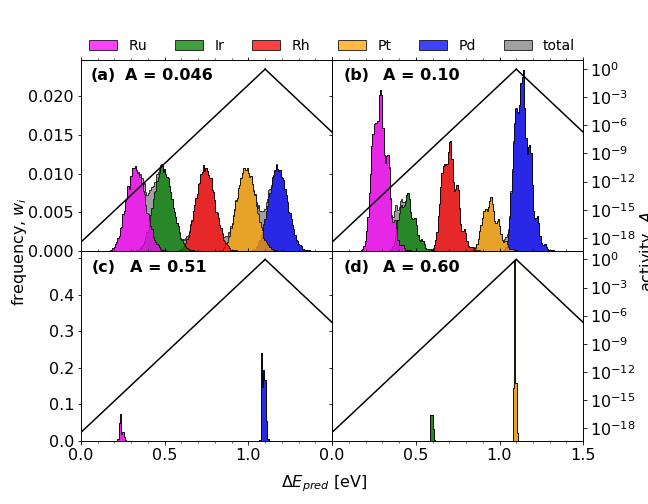
The script for performing the composition optimisation is found here .